The Negative Effects of Dirty Data
Introduction
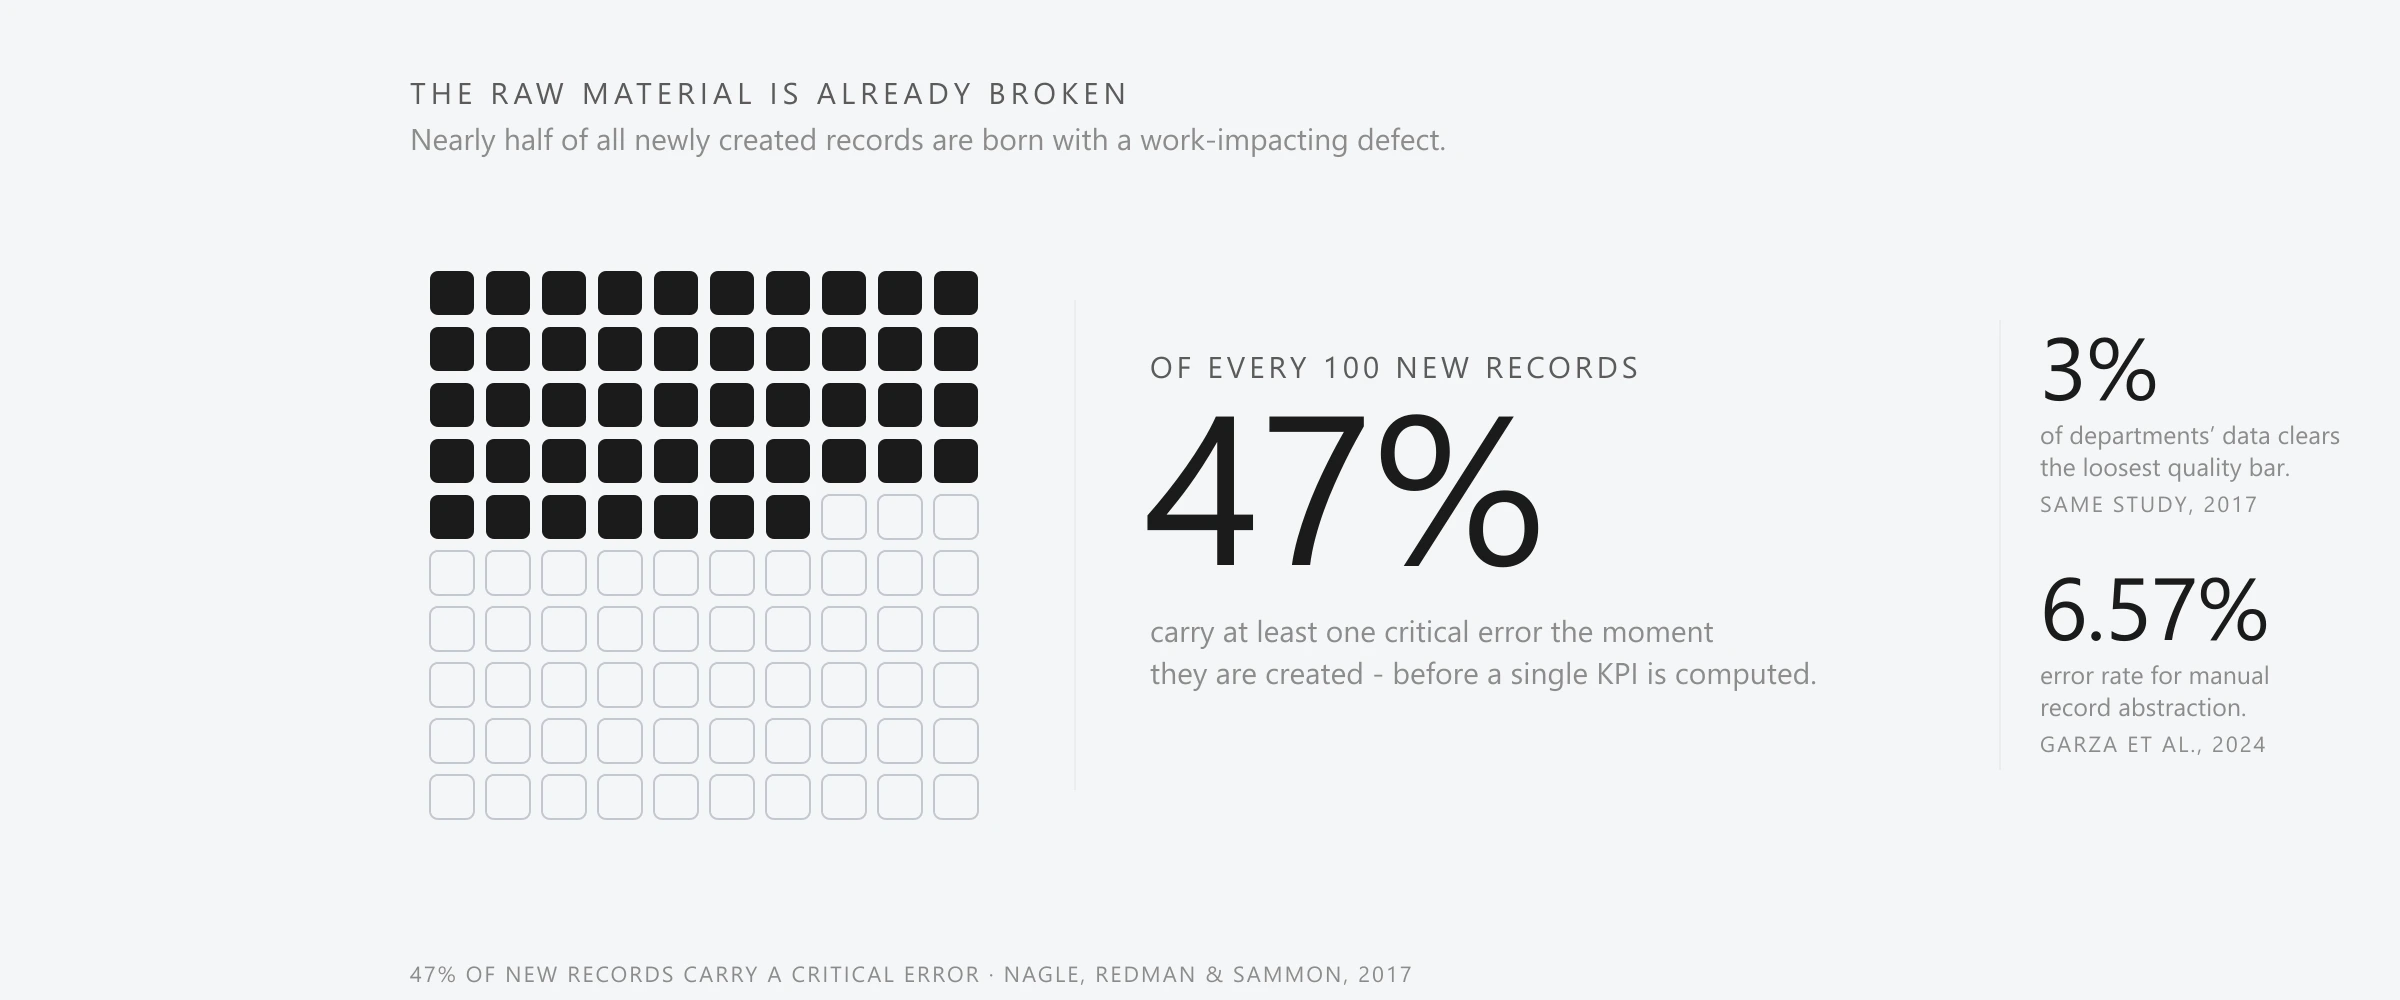
A pest-control or lawn-care operator opens a dashboard, reads a churn rate, a lifetime value, a revenue-per-route figure, and makes a decision on it. The number looks precise. It is also, very often, wrong - not because the software miscalculated, but because every KPI is a deterministic function over stored records, and the records underneath have been accumulating duplicates, mis-keyed statuses, and free-text drift for years. In the strongest direct measurement available, 47% of newly created records carried at least one critical error, and only 3% of departments cleared even the loosest “acceptable” quality bar. The model on top of that data can be flawless and the answer still be false.
- The raw material is defective at creation. Human entry, free-text fields, and address chaos make operational data dirty by structure, and the platforms’ own field checks catch only a fraction of it.
- Every KPI inherits the defects arithmetically. Duplicates inflate counts, padded bases hide churn, split records deflate lifetime value, and unstandardized addresses corrupt route economics - each in a knowable direction.
- Standardization is a pipeline, not a scrub. Profiling, parsing, standardizing, matching, and survivorship are a well-defined discipline with decades of peer-reviewed method behind them.
- When the data is cleaned, the numbers move. The shift is not cosmetic: it changes which customers you think you have, which you are losing, and where the money actually comes from.
What dirty data costs
Before the mechanics, the stakes. Gartner puts the cost of poor data quality at an average of $12.9 million a year per organization - a self-reported estimate, but a useful headline for a bill that is paid long before anyone trains a model. Thomas Redman, writing in MIT Sloan Management Review, frames it as a share of the top line: the total cost of bad data runs to roughly 15% to 25% of revenue for most companies, of which about two-thirds can be permanently eliminated. The mechanism is what he calls the “hidden data factory”: because errors created upstream force every downstream consumer to find, fix, and reconcile them, knowledge workers waste roughly half their time on data they cannot trust, and it costs about ten times as much to complete a unit of work on flawed data as on clean data.
The empirical anchor is the one already quoted: in the “Friday Afternoon Measurement”, 75 managers scored their last hundred records each, and the average share of new records with a critical, work-impacting error was 47%; individual scores ranged from 0% to 99%. This is direct measurement of the raw material, not a modeled economy-wide guess, which is what makes it the most defensible number in the field. Independent benchmarks bound the same range: Experian research found roughly a third of customer data believed inaccurate, with only 51% of organizations trusting their CRM and ERP data enough to act on it, and an IBM analysis citing Forrester reports that more than a quarter of organizations lose over $5 million a year to poor data quality, with 7% losing more than $25 million. For a field-service operator, that tax is not abstract. It is the customer counted twice, the route that missed a stop, and the churn that showed up as a surprise.
Dirty by structure
Operational data in this world is not dirty by accident; it is dirty by structure, from a handful of compounding sources. The best-documented human-keying benchmarks come from clinical data management - not field-service specifically, but the strongest evidence that exists. A meta-analysis of 93 studies found pooled field-level error rates of 0.29% for single entry, 0.14% for double entry, and 6.57% for manual record abstraction. The load-bearing contrast is the last one: reading a messy record and re-keying it errs at 6.57%, roughly 47 times the rate of disciplined double entry. That is precisely what a technician or CSR does all day - transcribe a name, an address, a service note from one place to another.
Field structure is the dominant lever on how bad it gets. In a controlled comparison, single-key entry of structured checkbox fields erred at 0.37 per 1,000, but handwritten numeric fields erred at 6.73 per 1,000, about eighteen times worse for free-form input. And free text does not just err more; it fragments. Unstandardized categorical values - “GEN PEST,” “general pest,” “gp,” “quarterly” typed four ways - produce what one peer-reviewed study of free-text clinical fields calls significant data noise that must be standardized before anything can be grouped. That is the exact mechanism by which service-type and technician-note fields in FieldRoutes, PestPac, and Aspire silently break every segment, cohort, and completion rate computed over them.
The reason a dedicated standardization layer is required - rather than trusting the platform’s own validation - is that native field checks do not clean the data. Studying clinical databases, researchers found that constraint-based validation detected only 2.3% to 26.9% of errors, and concluded that error detection based on data-constraint failure “significantly underestimated total error rates.” A value that is format-valid but wrong - the right number of digits, the wrong number; a plausible address that does not exist - passes straight through the form and into the KPI.
Addresses are the hardest case of all, because the same physical stop can be typed dozens of valid-looking ways. USPS Publication 28 defines a standardized address as one using the postal standard abbreviations and a complete address as one that matches USPS ZIP+4 and City/State files exactly, collapsing AVENUE to AVE, STREET to ST, and a long tail of variants to one form. Until “123 North Main Street Apartment 4” and “123 N Main St #4” are normalized, they do not collide, and each becomes a phantom duplicate customer. The scale of address defect in the wild is enormous: 6.8 billion mailpieces, 4.3% of the total, were undeliverable as addressed in a single year, costing $1.5 billion just to process. And addresses decay continuously - 8.4% of Americans, 27.1 million people, changed residence in 2021, roughly one household in twelve, even at a multi-decade low. The address on file is wrong more often than anyone thinks, and it keeps going wrong.
Why one operator runs many systems
There is a structural reason a single operator’s data lives in several incompatible shapes: the industry is one of the most acquisition-intensive in all of services. There are roughly 31,307 pest-control businesses in the United States, in a market of about $29.9 billion, and the consolidators absorb them by the hundred. Rollins, the parent of Orkin and a dozen other brands, completed 44 acquisitions in 2024 and 99 over three years; Anticimex has made more than 400 acquisitions since 2012, now running 40 to 50 deals a year; and the Rentokil-Terminix merger, at $6.7 billion, created a group with roughly 4.9 million customers. The green industry it borders is even more fragmented. Every one of those deals arrives with its own customer database, its own service codes, and its own duplicates - and the same customer can now exist under two brands at once.
How hard is it to reconcile all of that onto common definitions? The best live evidence is the largest player’s own reporting. By the end of 2024, only about 15% of the Terminix branch network was fully integrated onto end-state IT systems - 58 branches, 987 technicians, and $373 million in revenue transitioned - and technician adoption of PestPac and its companion app had risen only from about 40% to 49% across the year. A global market leader needs multiple years to move its acquired book onto one operational data system, and it is standardizing onto PestPac by name. That is not a failure of effort; it is the true difficulty of the problem. The customer records themselves are the asset being bought: when FieldRoutes was acquired in 2024, its buyer booked $89.3 million of the purchase price as customer-relationship intangible assets. The data is the business. Its condition is not a back-office detail.
What clean actually means
“Clean” is not a vibe; it is a set of measurable dimensions with a standard behind them. The DAMA UK working group’s Six Primary Dimensions for Data Quality are the concise canonical list: completeness (is anything missing), uniqueness (is a thing recorded only once), timeliness (does it still reflect reality), validity (does it conform to its format and range), consistency (do two copies agree), and accuracy (does it match the real-world thing). Accuracy is the subtle one: it “can only be achieved by assessing the data against the actual thing it represents, or against an authoritative reference data set” - you cannot certify an address or a service outcome from its format alone. At the standards level, ISO 8000 frames quality data as portable data that meets stated, machine-verifiable requirements, and its process reference model is what makes data quality a continuous discipline rather than a one-time cleanup.
The work of getting there is a pipeline, and it has been described in the literature for a quarter-century. Rahm and Do’s foundational survey situates data cleansing as a major part of the ETL process and decomposes the transformation into parsing free-form fields (their canonical examples are “name and address”), validating and correcting, standardizing to a uniform format, and finally matching and eliminating duplicates so that “duplicate information is purged and complementing information is consolidated.” It begins with data profiling - discovering the metadata, patterns, and constraints actually present in the data - which both drives the cleansing rules and doubles as the instrument that monitors quality over time. It ends with survivorship: matched duplicates resolve into one authoritative “golden record,” the discipline master data management exists to enforce. Profiling, standardize, match, survive, monitor. That loop is the layer an operator is missing.
Resolving the duplicates
The heart of the pipeline is deciding when two records are the same customer. In the literature this is entity resolution, and when it runs within a single database it is called deduplication. It is only hard when there is no shared key - and there almost never is: the same customer turns up under a slightly different name, a reformatted address, and a phone number typed three ways, with nothing to join on. As Christen notes, if a reliable unique identifier existed, “the problem becomes trivial: a simple database join is all that is required.” The field-service reality is the opposite of trivial.
Matching techniques fall into deterministic (exact rules), probabilistic (weighted approximate comparison), and learning-based approaches, and which one wins is context-dependent, so mature systems hybridize rather than dogmatize. The probabilistic foundation is the Fellegi-Sunter model from 1969, which scores each candidate pair by a likelihood ratio and sorts it into one of three outcomes - a confident match, a confident non-match, or a “possible match” routed to human review - with the two thresholds set to bound the false-match and false-non-match rates. Exact equality is useless here because real data does not agree character by character: in one Census region, 25% of first names and 15% of last names did not match exactly among records that were genuinely the same person. So the field runs on approximate comparators - Levenshtein edit distance (the minimum insertions, deletions, and substitutions between two strings, with the dynamic-programming algorithm from Wagner and Fischer in 1974), Jaro and Jaro-Winkler with their prefix weighting, and phonetic keys like Soundex that let SMITH and SMYTH share a code.
The catch is scale. Comparing every record to every other is quadratic, so two databases of a million records each imply a trillion comparisons while the true matches grow only linearly. The answer is blocking: partition the records by some key - a ZIP code, a phonetic surname, a date - and only compare within a block. The canonical illustration is that blocking on ZIP reduces 90 billion candidate pairs to 30 million, and “appropriate parsing of name and address components is the most crucial part of computerized record linkage.” This is exactly why address standardization is not a side quest. USPS CASS certification requires address software to hit at least 98.5% accuracy on ZIP+4 and carrier-route coding and 100% on delivery-point coding, running delivery-point validation and rename lookups to turn a free-typed address into a stable key. Complementarily, the Census geocoder resolves a messy address to one standardized form plus coordinates, so two records that read differently but geocode to the same rooftop finally collide. Business and customer lists, Winkler notes, are the hardest case of all - the same entity appears under its physical, billing, and owner addresses - which is precisely the field-service customer record.
How the numbers move
Now the payoff. Every KPI an operator reads is a count, a ratio, a sum, or a geospatial aggregate over those records, so a record-level defect propagates into the aggregate arithmetically and in a knowable direction. The formulas are not in dispute: churn is churned customers over the starting base; retention is its complement; acquisition cost is spend over new customers; lifetime value is revenue per customer over churn; and field-service platforms publish their own targets, with FieldRoutes naming a technician-utilization floor above 70% and a cancellation rate under 5%, alongside first-time-fix rate as the operational cousin. Hold the formula fixed and feed it defective records, and the output moves in a direction you can predict.
| KPI | What years of dirty data do to it | Which way it moves |
|---|---|---|
| Active-customer count | One real customer stored as several records | Overstated |
| Churn rate | A padded or duplicated base and blank cancel statuses hide real losses | Understated |
| Retention | A re-created account reads as a new logo while its predecessor reads as churned | Understated |
| Customer lifetime value | Revenue and tenure split across duplicate records | Understated |
| Acquisition-cost efficiency | An inflated new-customer count makes marketing look cheaper | Flattered |
| Revenue / average ticket | Duplicate invoices overstate; unbilled delivered work leaks | Either way |
| Revenue per route | Unstandardized addresses drop out of density or misgeocode | Corrupted |
| First-time completion | Free-text service types fragment the buckets it is computed over | Unreliable |
The directions are not hand-waving. Duplicates inflate counts and corrupt aggregations by construction; a padded starting base artificially lowers your churn rate because it sits in the denominator. And the magnitude of the underlying defect is real: the cleanest quantified before-and-after in the whole literature is a national dataset whose duplicate rate fell from 10% to 2% once computerized record linkage was applied - an 80% reduction in duplicates, which is to say every count, ratio, and per-customer figure computed over that data moved. When a padded base collapses and split records merge, the churn you thought you had and the churn you actually have stop being the same number.
Why that correction is worth the trouble is settled economics. The classic Bain and Harvard Business Review finding is that raising retention by five points raises profit by between 25% and 95%, and that acquiring a new customer costs five to twenty-five times as much as keeping one. A churn number that is quietly understated by duplicate accounts does not just misreport the past; it misdirects the single highest-leverage decision the business makes. Getting the denominator right is not bookkeeping. It is strategy.
Garbage in, garbage out
Everything above is upstream of analytics and AI, which inherit the data’s condition wholesale. Controlled experiments across nineteen machine-learning algorithms and six data-quality dimensions found model performance bounded by the quality of the training data: injecting label noise into 20% of samples cut accuracy by up to about ten percentage points, and once label accuracy fell far enough the model did worse than a constant guess. A 101-paper systematic review affirms the same foundational point. Two failures make it concrete. Unity told investors it lost roughly $110 million of 2022 revenue in part from ingesting bad data that degraded an ad-targeting model, a disclosure that coincided with a sharp stock drop. And Public Health England undercounted 15,841 COVID-19 cases because positive results accumulated in a legacy spreadsheet capped at 65,536 rows; once full, new cases were silently dropped before they ever reached the dashboard - a pure standardization defect upstream of the number, which is the exact risk of piping raw platform exports into analytics.
There is a fitting irony in the field’s most-quoted statistic about this work. The claim that data scientists spend “80% of their time” cleaning data is itself a data-quality cautionary tale: it traces not to a survey but to a 2014 newspaper article that gave a range of “50 to 80 percent,” while CrowdFlower measured cleaning and organizing at 60% and Anaconda later measured data preparation at about 45%. The honest reading is a wide, definition-dependent range - somewhere from roughly 15% to 80% - that is nonetheless, consistently, the single largest time sink in the work. The precise figure is folklore; the direction is not. Cleaning is where the time goes because dirt is where the value leaks.
From cleanup to operations
None of this is a reason for despair, and it is emphatically not a reason to distrust the numbers into paralysis. It is a reason to build the layer that most operators are missing. The evidence is candid about its own limits - the entry-error and dedup benchmarks come from clinical and census domains, and the exact percentage a given KPI shifts for a given book of business is specific to that book - but the shape of the problem is unambiguous, and so is the shape of the fix. Standardization is a known discipline: profile the data, parse and standardize the free-form fields, resolve the entities, survive the duplicates into golden records, and then monitor so the quality holds instead of decaying. It is the same reason migrations go wrong when it is skipped; Gartner has reported that more than half of data-migration projects exceed their budget or timeline or harm the business, driven by exactly this flawed handling of the underlying data.
This is the discipline Ardenus brings to the operators who run the physical economy. Rather than read KPIs off a fragmented, duplicated data estate, Ardenus sits on top of the systems a business already runs - a FieldRoutes, a PestPac, an Aspire - and unifies, standardizes, resolves, and governs the records underneath, so the numbers an operator acts on describe the business that actually exists. It is the standardization and intelligence layer beneath honest reporting, built for the industries most likely to be handed a dashboard and least equipped to trust one. You can read more of our research on the Ardenus articles hub, or see the platform itself on the technology page.
Sources and methodology
- Only 3% of Companies' Data Meets Basic Quality Standards (Nagle, Redman & Sammon, Harvard Business Review, 2017; the “Friday Afternoon Measurement,” also in Business Horizons, 2020) - the 47% / 3% figures and the “rule of ten.”
- Seizing Opportunity in Data Quality (Redman, MIT Sloan Management Review, 2017) and Bad Data Costs the U.S. $3 Trillion Per Year (Redman, HBR, 2016) - the 15-25% of revenue, the hidden data factory, and the ~50% wasted-time figure.
- How to Improve Your Data Quality (Gartner, 2021) - the $12.9M/year average; Experian Global Data Management Research (2021); and The Cost of Poor Data Quality (IBM, citing Forrester, 2025).
- Data entry error in electronic data capture (Garza et al., International Journal of Medical Informatics, 2024); Quantitative comparison of double vs single data entry (Paulsen, Overgaard & Lauritsen, PLOS ONE, 2012); A weighty problem: data-constraint validation (Goldberg, Niemierko & Turchin, AMIA, 2008); and standardizing free-text categorical values (SALT-C, JMIR Medical Informatics, 2019).
- USPS Publication 28, Postal Addressing Standards (2024); Undeliverable as Addressed Mail (USPS Office of Inspector General, 2014); and Geographic Mobility: 2020 to 2021 (U.S. Census Bureau, CPS ASEC).
- Number of pest-control businesses and market size (IBISWorld, 2026); Rollins Form 10-K (SEC EDGAR, 2025); how EQT scaled Anticimex (EQT, 2024); Rentokil acquires Terminix (PCT, 2021) and completion (Rentokil, 2022); Rentokil 2024 Preliminary Results (2025); and the Form S-1 recording $89.3M of customer-relationship intangibles (SEC EDGAR, 2024).
- The Six Primary Dimensions for Data Quality Assessment (DAMA UK, 2013); ISO 8000 (ECCMA); Data Cleaning: Problems and Current Approaches (Rahm & Do, IEEE, 2000); Profiling relational data (Abedjan, Golab & Naumann, VLDB Journal, 2015); and Master Data Management (Gartner Glossary).
- A Survey of Indexing Techniques for Scalable Record Linkage and Deduplication (Christen, IEEE TKDE, 2012); A Theory for Record Linkage (Fellegi & Sunter, JASA, 1969); Overview of Record Linkage (Winkler, U.S. Census Bureau, 2006) and the 1993 blocking analysis; deterministic vs probabilistic linkage (Oliveira et al., 2016); binary codes (edit distance) (Levenshtein, 1966); the Soundex system (U.S. National Archives); USPS CASS certification; and the Census Geocoding Services API.
- churn, retention, CAC, LTV formulas (Wall Street Prep, Corporate Finance Institute, Chargebee); field-service KPI targets (FieldRoutes) and first-time-fix rate (VSight); how duplicates corrupt aggregations (Estuary) and how a padded base lowers churn (ZoomInfo); and The Value of Keeping the Right Customers (Reichheld, HBR, 2014).
- The Effects of Data Quality on Machine Learning Performance (Mohammed et al., Information Systems, 2025); Data quality in machine learning: a systematic review (Cote et al., 2024); Unity Q1 2022 earnings call; England's COVID case-data spreadsheet error (The Register, 2020); CrowdFlower Data Science Report (2016) and Anaconda State of Data Science (2020); and Gartner on data-migration failure rates.