Churn Is a Distribution, Not a Number
Introduction
A multi-branch operator opens a board deck and reads one number for the whole business: churn, or its mirror image, retention. One figure for a book built from tens of thousands of accounts across dozens of branches. It looks precise, and it is almost always the wrong object. Churn is not a number. It is a distribution - across customers, across cohorts, and across branches - and collapsing it to a single blended rate does not just lose detail, it systematically misprices the business. The distribution is where the value is decided, and the blended average is often a rate that no cohort actually experiences.
- Lifetime value is convex in retention. The standard closed-form CLV carries the retention rate as margin x r / (1 + d - r), which rises faster and faster as retention climbs. Because the curve bends, the average value of a mixed book is higher than the value computed at the book’s average retention, so a blended rate understates.
- A heterogeneous base sorts itself.High-churn customers leave first, so a cohort’s observed retention rate rises with tenure on its own, even when no individual customer has changed. The number moves for reasons that have nothing to do with how well you are actually retaining anyone.
- Not every churning customer is worth saving. The highest-risk accounts and the most save-able accounts are close to statistically independent, and roughly half of the money spent on retention is typically wasted on customers a campaign cannot move.
- Retention is decisive, but not sovereign. It is the highest-leverage single input in a lifetime-value calculation, yet on real books future acquisition can matter more. Treat “retention beats everything” as a hypothesis to test on your own data, not a law.
What is a healthy cancellation rate?
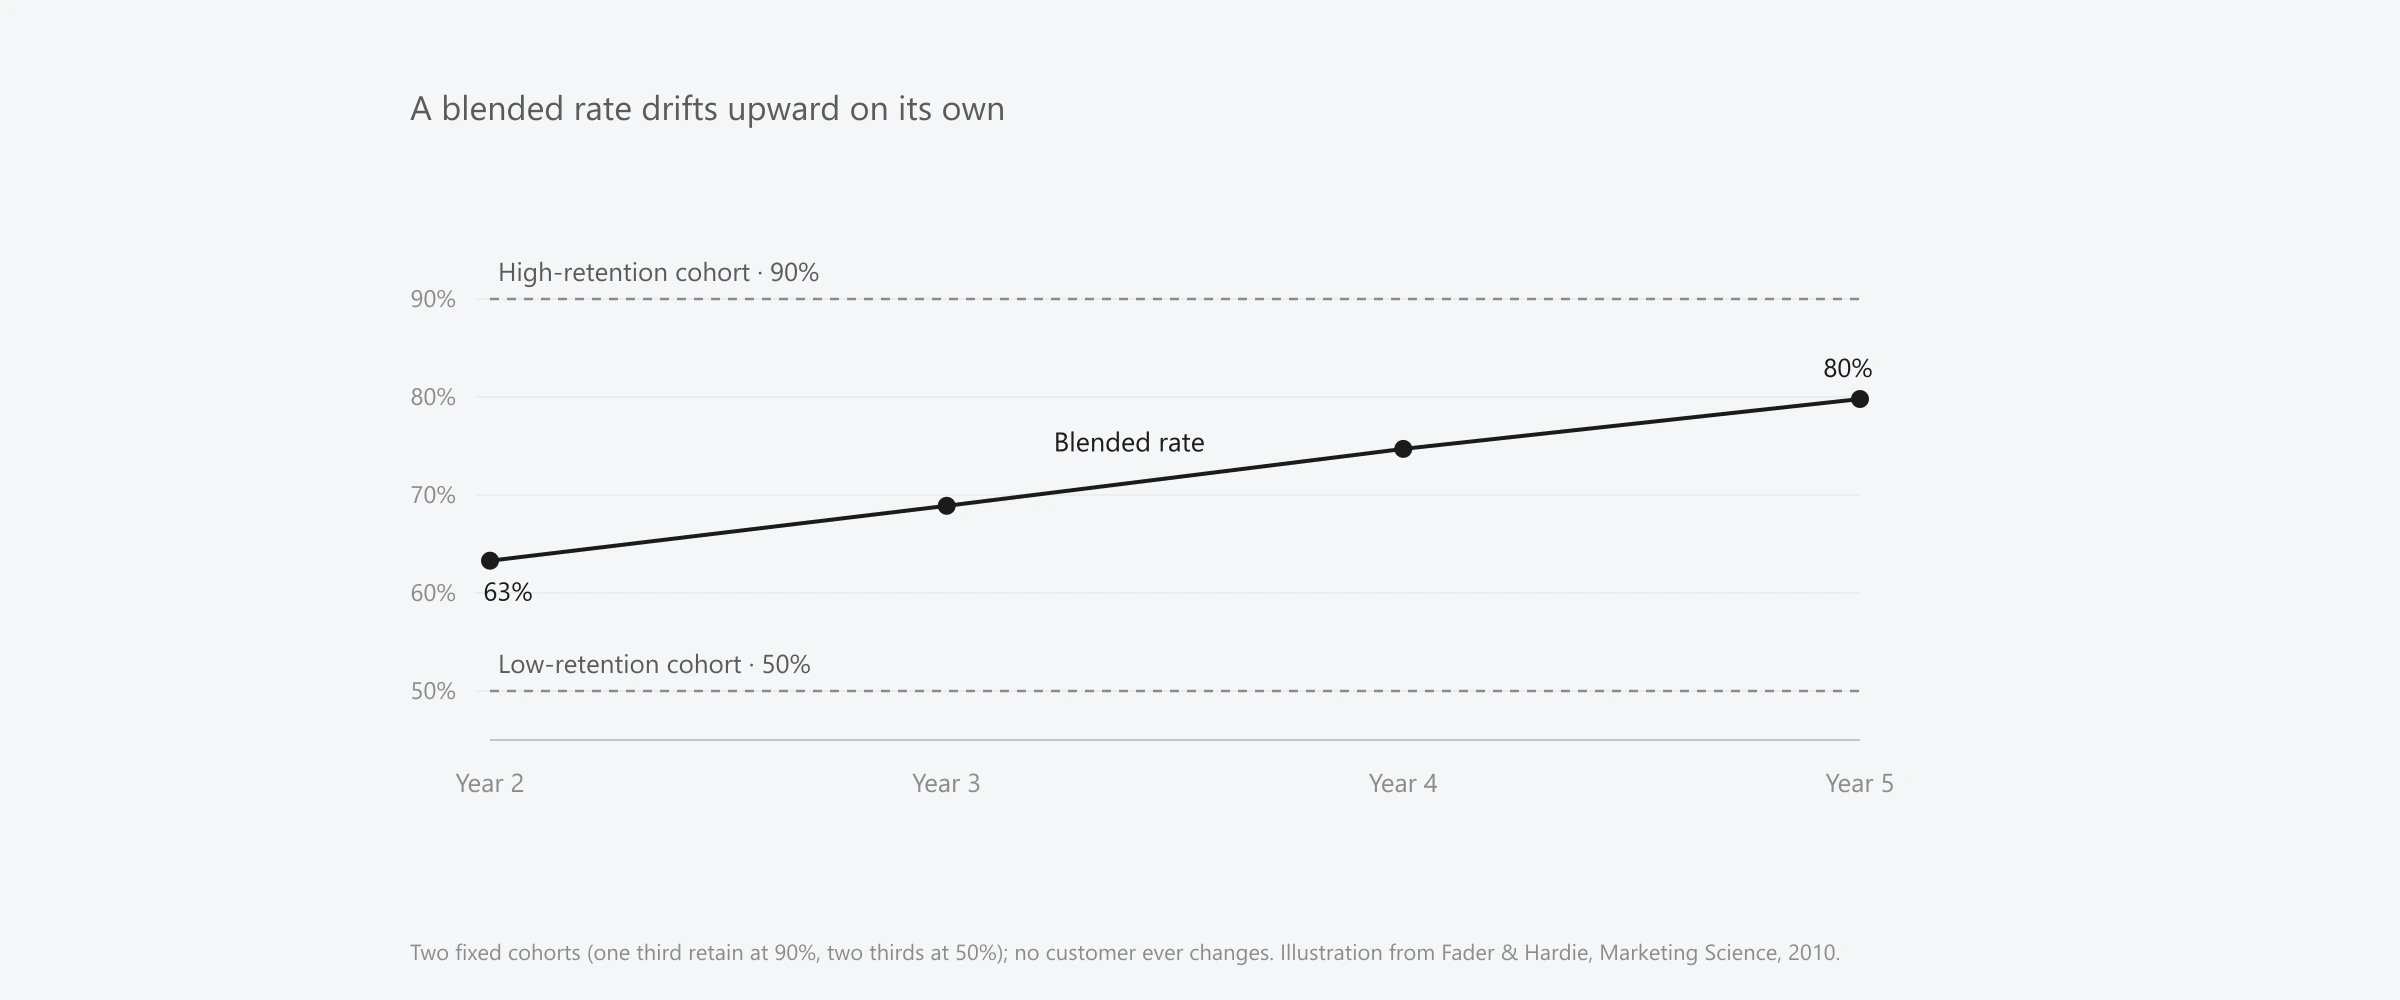
There is no single healthy cancellation rate, and asking for one is the first mistake. A blended rate is an average over a population that is not homogeneous, so the average describes a customer who does not exist. Take the simplest possible book, from Fader and Hardie’s analysis: one third of the customers retain at 90% a year and two thirds retain at 50%, and no individual customer ever changes. The blended retention rate of that book in its second year is about 63% - a figure that describes neither cohort.
Worse, the blended rate does not even hold still. Because the high-churn customers leave first, the survivors are increasingly the loyal ones, so the same book’s observed retention rate drifts upward on its own - to roughly 80% by year five - with nothing about any customer having changed. A single “healthy” number cannot survive that: the same 63% can be a book sorting toward a loyal core or a deteriorating one, and the average cannot tell you which. The honest answer to “what is a healthy cancellation rate” is therefore a method, not a number: measure retention per cohort, value the book cohort by cohort, and read the shape of the distribution and its tail, not the mean.
Lifetime value, acquisition cost, and LTV-to-CAC
Why does averaging understate value rather than merely blur it? Because the arithmetic of lifetime value is convex in the retention rate. In the canonical formulation, the future value of a retained customer is proportional to margin times r / (1 + d - r), where r is the per-period retention rate and d is the discount rate. That function is strictly increasing and strictly convex in r: each additional point of retention is worth more than the last. In one worked example in the same source, dropping yearly retention from 90% to 80% cut lifetime value by 37%, although in that illustration the effect was amplified by a rising per-customer margin as well as by the retention change, so read it as directional rather than as a clean isolation of the curvature.
Convexity has a direct consequence for a mixed book. When a quantity depends convexly on a rate, the average of the quantity across a heterogeneous population is greater than the quantity evaluated at the average rate. Applied to a customer base, the average lifetime value of the 90% and 50% cohorts above is higher than the lifetime value you would compute at their blended 63%. Pricing the book at the blend leaves value on the table, and it does so more the wider the spread. This is why the LTV-to-CAC ratio, computed at a single blended retention, mis-ranks the business: it understates the lifetime value of the high-retention cohorts that clear the bar comfortably and flatters the low-retention cohorts that do not, so the ratio you act on is not the ratio you have.
Retention vs acquisition: which moves value more?
Retention is the highest-leverage single lever in a customer-value model, and the most-cited estimate makes the point crisply: modeling five high-growth, internet-era public companies, Gupta, Lehmann and Stuart found that a 1% improvement in retention, margin, and acquisition cost improved firm value by 5%, 1%, and 0.1% respectively. Retention dominated the other two levers by a wide margin. One caveat has to travel with that number, though: it is an elasticity of the equity value of publicly traded firms, estimated to value high-growth companies against their market capitalization. It is not a change in a private operator’s operating profit, and the specific “5%” must not be stapled onto an operator’s EBITDA. The durable lesson is directional: of the levers inside a lifetime-value calculation, retention has the most curvature, so burying it in a single blended rate hides the most.
The honest counterweight is that retention is not automatically the top value driver in every business. Studying more than 2,000 companies over ten years, Schulze, Skiera and Wiesel found an average leverage effect of 1.55 - percentage changes in customer equity are amplified, not passed through one for one, into shareholder value - and, more pointedly, their findings challenge the assumed dominant effect of the retention rate and elevate the importance of predicting the number of future acquired customers. For a fast-growing operator adding customers quickly, the value of the next cohort of acquisitions can outweigh a point of retention on the existing book. The resolution is not to pick a winner in the abstract but to measure both on your own data. Retention convexity is real; retention supremacy is a claim to test.
Why a single blended rate misprices the book
The deepest reason a blended rate misleads is that a heterogeneous base sorts itself over time, and the sorting shows up in the number even when behavior is constant. Fader and Hardie put a figure on the damage: valuing a customer base at a single aggregate retention rate understates its value by roughly 25% to 50%in standard settings, with the error scaling with how heterogeneous the base is - modest for a nearly uniform book, large for a polarized one. The mechanism is a sorting effect, sometimes called the ruse of heterogeneity: a base is a mixture of low-churn and high-churn customers, the high-churn ones drop out first, so the survivors are increasingly the low-churn ones, and the observed retention rate of a cohort climbs with tenure even though no single customer’s propensity ever changed. Their shifted-beta-geometric model makes this precise, treating churn as a distribution of propensities across customers rather than a shared constant.
This is an old and well-founded result. In non-contractual settings, where a customer can lapse silently with no cancellation event, Schmittlein, Morrison and Colombo built the Pareto/NBD frameworkthat infers whether a customer is still active from the timing of past activity, modeling explicit heterogeneity in both purchasing and dropout rates. The practical warning for an operator is the same in both models: a single blended rate mixes populations that should be measured, and priced, separately. That heterogeneity is not a theoretical worry: it is why a book’s observed retention rate can climb even when no customer has changed, and why averaging it away does not make the book more knowable. It makes it less.
| What you read | What a single blended rate hides | The consequence |
|---|---|---|
| One churn rate for the book | A wide branch-to-branch distribution | A rate no branch experiences; wrong target for all of them |
| A stable rate over time | Cohort retention rising as the base sorts | Improvement claimed, or missed, that is really composition |
| Headcount retention | Revenue-weighted retention diverging from it | A branch looks healthy while its dollars shrink |
| Lifetime value at the average rate | Convexity across the distribution | Customer-base value understated, more so the wider the spread |
| A branch ranked “bad at retention” | Whether the gap is mix or execution | The wrong branch coached, the wrong lever pulled |
Which customers are actually worth saving
If churn is a distribution, retention spend should be aimed at a specific part of it - and it is usually aimed at the wrong part. The instinct is to target the customers at the highest risk of leaving. Ascarza tested that instinct in two randomized field experiments and found it wanting: the overlap between the highest-risk customers and the customers most responsive to a retention intervention was about 50%, no better than random. Risk and save-ability are close to independent. Targeting responsiveness instead of raw risk produced an additional 4.1 and 8.7 percentage points of churn reduction in the two studies, and the blunt summary is that half of the retention money is wasted, but the method identifies which half. Some of the highest-risk customers were nearly unsavable regardless of the offer, and for some segments the intervention actually increased churn.
The operational translation is concrete. A save program that fires at the top of a churn-risk score is spending against a population that is partly unreachable and partly indifferent. The disciplined alternative is to run a randomized pilot, estimate the incremental effect of the intervention per cohort, and target only the customers whose likelihood of leaving actually falls because of it. That is targeting the distribution, not the mean: not “who is most likely to churn,” but “whose churn will bend if we act.”
Mix or execution: decompose before you benchmark
Before ranking a branch as good or bad at retention, separate two very different causes. Two branches can post different churn because they sell to different customers (mix) or because they serve the same customers differently (execution). Confusing the two is how a branch gets coached for a problem it does not have. The warning from the profitability literature is that tenure itself is a weak proxy for value: studying long-life customers in a non-contractual setting, Reinartz and Kumar found that long-life customers are not necessarily profitable customers, and across 16,000 customers in four companies loyalty and profitability were only loosely linked, sorting customers into four types - the profitable-and-loyal, the profitable-but-transient, the loyal-but-unprofitable, and the neither. A branch full of loyal but low-value accounts can post excellent retention and mediocre economics.
The decomposition is our own applied analytic, not a figure from the literature, but it follows directly from the sorting mechanism: attribute a branch’s retention gap to its acquisition mix (channel, plan, price tier, geography, the vintage of its book) before attributing it to service quality, because a cross-sectional churn comparison confounds the two. Only after the mix is netted out does the residual measure execution, which is the part a branch can actually be coached on. Benchmark the residual, not the raw rate.
How churn quality moves the valuation multiple
For a private-equity-backed operator, all of this eventually meets the exit. The modern approach to pricing a customer base, customer-based corporate valuation, builds firm value from the bottom up out of cohorts of customer acquisition, retention, and spend rather than from a top-line multiple. Its founding work values subscription businesses from publicly disclosed customer data, and its non-contractual extension handles the harder case in which churn is not observed and must be inferred from a model. The through-line is that a rigorous buyer does not price the average churn rate; it prices the retention distribution and its cohorts. A book with a tight, high distribution is worth more than a book with the same blended average and a long low-retention tail, because the second book is quietly losing its most valuable cohorts and the average hides it.
That is the case for measuring churn as what it is. A single blended rate is an accounting convenience that misprices the book, mistargets the save budget, and misreads the branches. The distribution behind it is where the retention economics, the lifetime value, and ultimately the multiple are actually decided. This is the discipline Ardenus brings to the operators who run the physical economy: it sits on top of the systems a business already runs and resolves, standardizes, and governs the records underneath, so an operator can read retention cohort by cohort and branch by branch, and act on the distribution rather than the average. You can read more of our research on the Ardenus articles hub, or see the platform itself on the technology page.
Sources and methodology
This essay was researched with a multi-agent sweep across primary and reputable sources, followed by an adversarial fact-check of every numeric claim. Three limitations are disclosed plainly. First, the strongest customer-base-valuation elasticities come from public-company equity data (Gupta, Lehmann & Stuart, 2004; Schulze, Skiera & Wiesel, 2012); they are used as directional evidence that lifetime value is convex in retention and that retention is a high-leverage lever, not as multiples to transport onto a private operator’s operating profit. Second, some sources were read at the level of the published abstract rather than the full text, and figures at that level are cited as such. No client or first-party operational data is used or disclosed anywhere in this essay; every figure is drawn from the published sources cited below, and no result, ratio, or dollar figure is attributed to Ardenus.
- Customer-Base Valuation in a Contractual Setting: The Perils of Ignoring Heterogeneity (Fader & Hardie, Marketing Science, 2010) and the underlying shifted-beta-geometric retention model(Fader & Hardie, 2007) - the 25% to 50% understatement and the sorting / ruse of heterogeneity.
- Customer Lifetime Value: Marketing Models and Applications (Berger & Nasr, Journal of Interactive Marketing, 1998) - the closed-form CLV carrying r, its convexity, and the 90% to 80% example.
- Valuing Customers(Gupta, Lehmann & Stuart, Journal of Marketing Research, 2004) - the 5% / 1% / 0.1% firm-value elasticities on five public companies, cited with the equity-value domain caveat.
- Linking Customer and Financial Metrics to Shareholder Value: The Leverage Effect (Schulze, Skiera & Wiesel, Journal of Marketing, 2012) - the 1.55 leverage effect and the challenge to retention’s assumed dominance.
- Retention Futility: Targeting High-Risk Customers Might Be Ineffective (Ascarza, Journal of Marketing Research, 2018) - the ~50% risk/response overlap, the 4.1 and 8.7 percentage-point gains, and “half of the retention money is wasted.”
- On the Profitability of Long-Life Customers in a Noncontractual Setting (Reinartz & Kumar, Journal of Marketing, 2000) and The Mismanagement of Customer Loyalty (Reinartz & Kumar, Harvard Business Review, 2002) - loyalty is not profitability, and the four customer types across 16,000 customers.
- Counting Your Customers: Who Are They and What Will They Do Next? (Schmittlein, Morrison & Colombo, Management Science, 1987) - the Pareto/NBD framework and inferred (unobserved) attrition.
- Valuing Subscription-Based Businesses Using Publicly Disclosed Customer Data (McCarthy, Fader & Hardie, Journal of Marketing, 2017) and the non-contractual extension(McCarthy & Fader, Journal of Marketing Research, 2018) - customer-based corporate valuation from cohorts of acquisition and retention.