Valuation Follows Revenue Quality, Not Revenue
Introduction
An owner, a lender, or a private-equity sponsor looks at a multi-branch field-service business and asks one question: what is it worth. The wrong way to answer is to start with revenue and reach for a multiple, as if the multiple were a property of the industry and size did the rest. It is not. Two businesses with the same revenue can trade at very different multiples, and the gap is not noise. It is revenue quality and the durability of growth, priced. Valuation follows the quality of the revenue, not the quantity of it.
- The multiple prices quality, not size. What lifts an EV/EBITDA multiple is the share of revenue that recurs, the share of growth that is organic, and the margin the business converts, not the top line. The cleanest public proxy in this sector reports about 75% recurring revenue and trades at a premium to its peers.
- Revenue is not value.Customer-based corporate valuation builds a firm’s value from the bottom up, out of cohorts of customer acquisition, retention, and spend, using only publicly disclosed data. A dollar that will recur is worth more than a dollar that will not.
- Operations earn the return, not financial engineering. Across Bain’s 44-deal, 2010 to 2019 buy-and-build sample, deals pursued for multiple arbitrage alone returned about 1.4 times invested capital, versus 2.2 times for those built on real operational improvement.
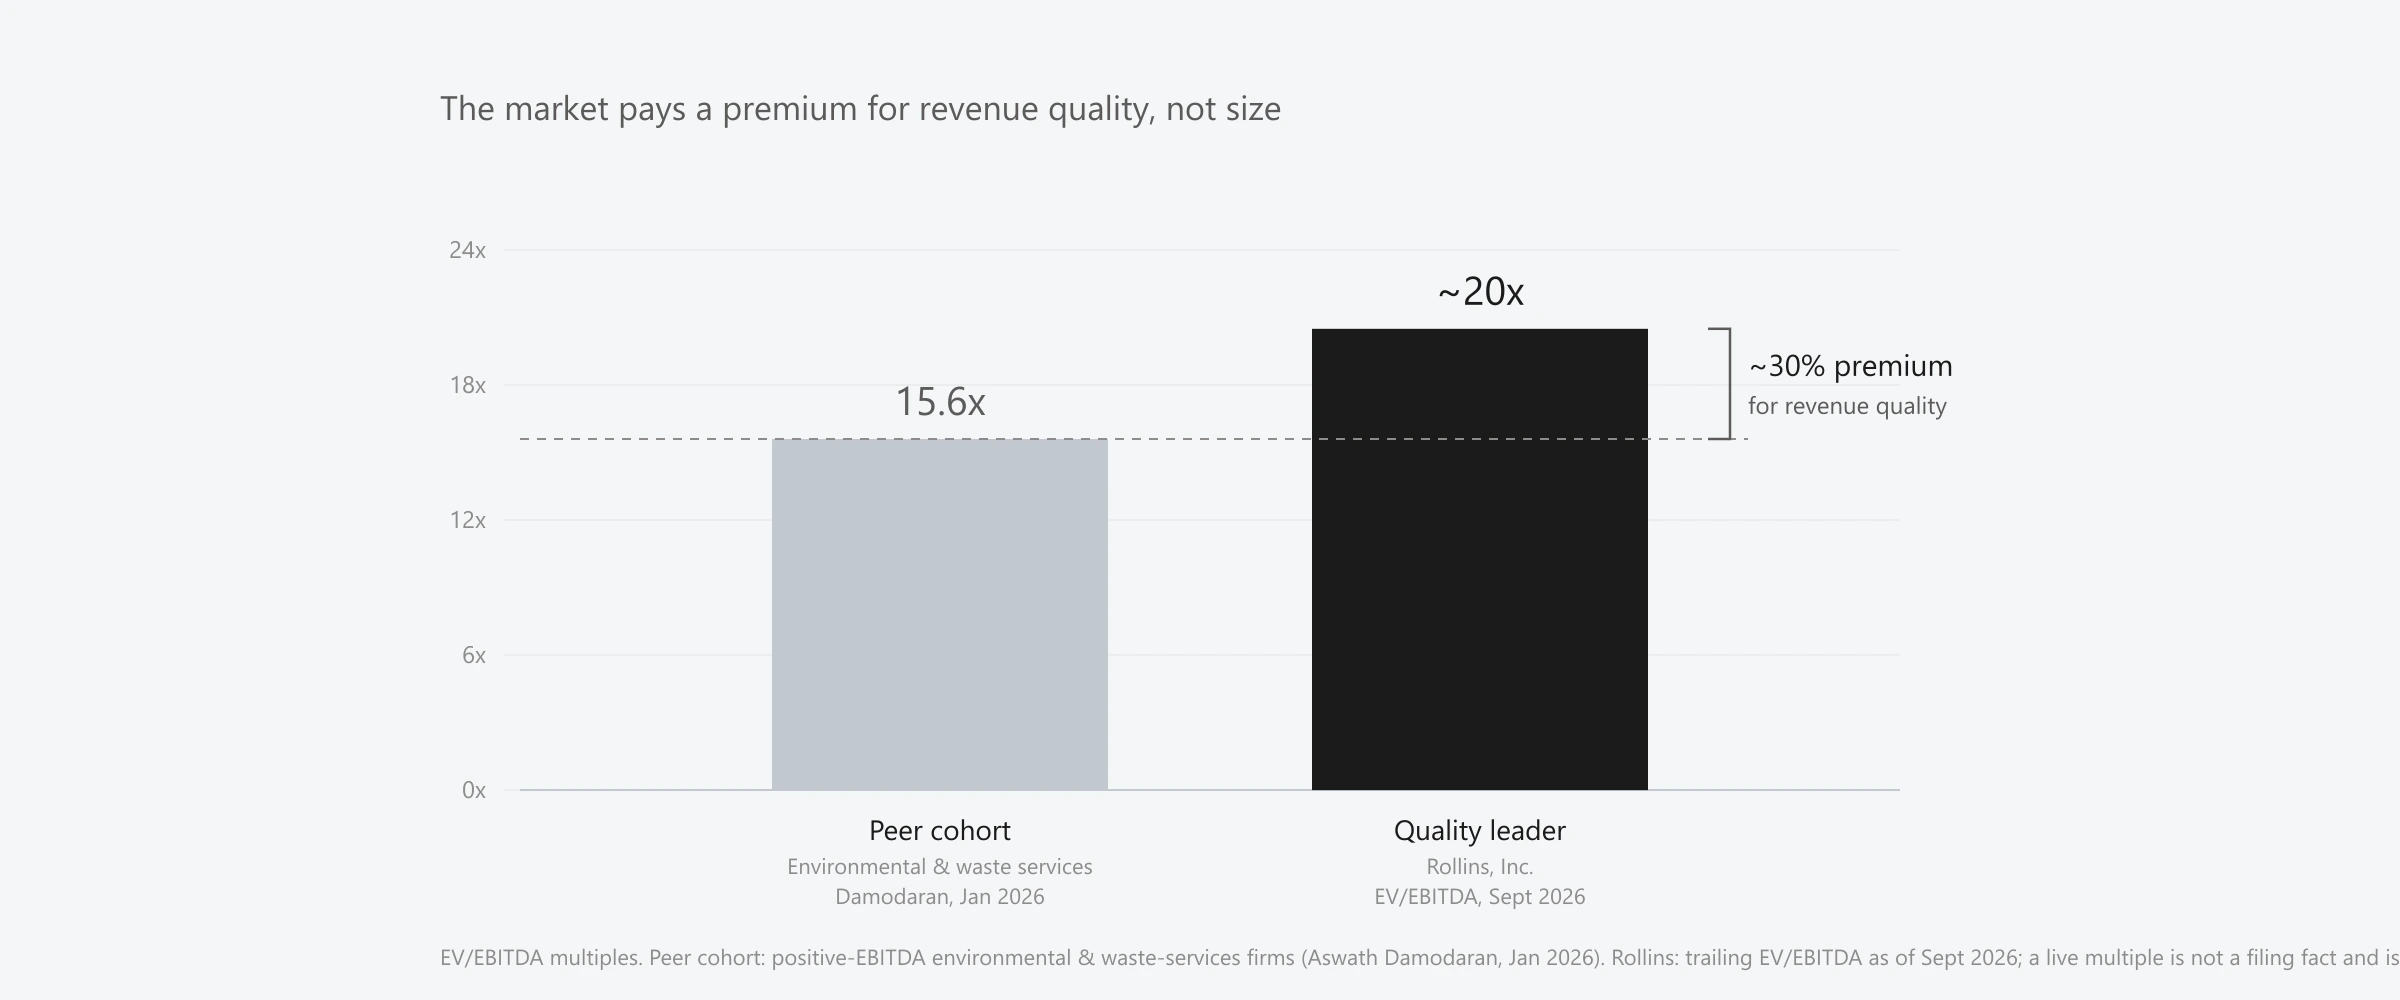
- The premium is observable and paid.As of September 2026 the sector’s cleanest public proxy trades at about 20 times EV/EBITDA, against a peer cohort near 15.6 times. That is roughly a 30% premium, and a rating gap rather than a size gap, since the larger operator trades below it.
Value, the level, and the multiple
Two different things get conflated in the phrase “what is it worth.” There is the value level, the enterprise value in dollars, and there is the multiple, the ratio of that value to a measure of earnings, usually enterprise value over EBITDA. The level answers how much; the multiple answers how much per dollar of earnings, and it is the multiple that carries the market’s judgment about the business. A multiple is not a fact about your industry that you look up in a table and apply. It is the market’s compressed opinion about how durable, how predictable, and how high-quality your earnings are, and how fast they will grow.
The distinction matters because the levers differ. Route density, technician productivity, and purchasing scale mostly move the level, through margin and free cash flow. Recurring-revenue share and the durability of growth mostly move the multiple. Both are worth having, but they are not the same lever, and conflating them produces the most common valuation error: the belief that adding revenue, by itself, re-rates the business. It does not. Revenue added at a flat multiple grows the level and leaves the rating where it was. To move the rating you have to change what kind of revenue the business earns.
Why revenue is not value
The rigorous way to value a business built on a book of customers is not to multiply revenue at all. It is to build value from the bottom up. Customer-based corporate valuation, developed by McCarthy, Fader and Hardie, estimates how many customers a firm will acquire, how long they will stay, and how much they will spend, then discounts the resulting margin to a present value. Its non-contractual extension handles the harder case, the one that describes most field-service books, in which a customer can lapse silently and churn is never directly observed but has to be inferred from a model of purchasing and dropout.
The through-line is simple and it is the crux of this essay: value is the discounted cash a customer base will produce, so a dollar of revenue from a loyal, recurring customer is worth far more than a dollar from a one-time job, because it will recur and the other will not. That is the formal statement of why revenue quality, not revenue, sets value. CBCV explains the value level directly; the EBITDA multiple that a buyer quotes is a shorthand for the same underlying quality, which is why the two move together. How to measure the retention distribution that sits underneath such a book, cohort by cohort rather than as a single blended rate, is the subject of our companion essay on why churn is a distribution, not a number.
What actually sets the multiple
If revenue quality sets value, what specifically does the market reward with a higher multiple? Three things, in roughly this order. First, the share of revenue that recurs: contractual, renewing revenue is predictable, and predictability is the single quality a multiple prices most directly. Second, the durability of growth: whether the top line grows because the business wins and keeps customers under its own power, or because it buys them. Third, the margin, and the return on the capital deployed to earn it, because margin is the evidence that the added revenue is quality and not merely volume.
Operations sit one layer beneath these. Route density and technician productivity are real and they matter, but they are level levers that work through margin, and they are the weakest direct setters of the multiple. They earn a premium multiple only insofar as they show up as higher-quality revenue and durable margin. That is the honest form of the claim: operations are a necessary input to a premium multiple, mediated through revenue quality, not a direct cause of it. The table below separates what re-rates a business from what merely grows it.
| Lifts the multiple | Grows the level, but does not re-rate | Why |
|---|---|---|
| A high and rising share of recurring revenue | A large top line | Recurring revenue is predictable, and predictability is what a multiple prices |
| Growth that is mostly organic | Growth bought through acquisitions | Organic growth signals a durable right to win; acquired growth can mask flat organics |
| Expanding margin from density and productivity | Revenue added at flat or falling margin | Margin is the evidence the added revenue is quality, not just volume |
| A retention distribution with a loyal core | A flattering blended retention average | The tail is where value leaks, and the average hides it |
| Ancillary work that deepens a recurring account | One-time jobs that reset each year | Deepening a recurring account compounds; one-time work starts over |
Recurring revenue and the quality of growth
The public proxy makes the abstraction concrete. Rollins, the largest listed pure-play in the sector, reports in its FY2025 Form 10-K that about 75% of its business is recurring services, 10% is ancillary, and 15% is one-time. And its growth is mostly organic: of the 11.0% revenue growth it posted in 2025, 6.9 points were organic and 4.1 came from acquisitions. A heavily recurring base that is still growing mostly under its own power is exactly the revenue-quality profile the market pays up for. No operator, Rollins included, publicly discloses a customer retention rate, so the recurring-revenue share is the closest public proxy for it, and here it is high.
Set that against the counterfactual. A business of similar size whose growth is mostly acquired, or whose base is mostly one-time work, will not command the same multiple at the same revenue, because neither its predictability nor its organic durability is as good. This is the quiet mechanism behind the rating gap between two operators who look identical on the top line. One is selling a renewing, compounding book; the other is selling this year’s revenue and starting over next year. The market has seen both before, and it prices the difference.
What the public comparables show
Put the public proxies side by side and the pattern is visible in two places. On margin, Rollins converts an 22.7% adjusted EBITDA margin (19.3% on an operating basis) in FY2025, while Rentokil Initial, the larger of the two by revenue, runs an adjusted operating margin of about 15.5%. That gap is a clean, primary-sourced quality contrast, and it does not run in the direction size would predict: the larger company earns the thinner margin.
On the multiple, the premium is equally plain. As of September 2026, Rollins trades at roughly 20 times trailing EV/EBITDA, against a peer cohort of environmental and waste-services firms at about 15.6 times (positive-EBITDA companies, in Damodaran’s January 2026 dataset). That is roughly a 30% premium. Three honest caveats travel with it. A live market multiple cannot be sourced to any filing, so it is stated as of a date and should be re-derived at the moment of use from current market value and trailing earnings; the peer cohort carries an earlier as-of date than the live quote; and that cohort is a broad environmental and waste-services aggregate, which folds in capital-heavy, slower-growth businesses, rather than a curated set of recurring-revenue service comparables, so the premium is directional rather than an attribution controlled for size, growth, or capital intensity. The durable point survives the caveats: the market pays a visible premium for the higher-quality revenue, and the gap does not run in the direction size alone would predict, since the larger operator is the one trading below.
How private equity actually earns the return
For a sponsor, the argument becomes concrete in the deal math, and the deal math is often misread. Bain’s Global Private Equity Report finds that multiple expansion has been the largest single driver of buyout returns over the past decade, worth almost 60% of returns. Read alone, that sounds like an argument for financial engineering: buy at a low multiple, sell at a higher one, and let the re-rating do the work. The buy-and-build evidence corrects the reading. In a sample of 44 buy-and-build strategies from 2010 to 2019, deals pursued for multiple arbitrage alone returned about 1.4 times invested capital, while deals built on a genuine strategic rationale, accelerating organic growth or materially improving margin, returned about 2.2 times.
Add-on acquisitions are now the majority of the activity: 72% of North American buyouts in 2022 were add-ons, by deal count. Put the two findings together and the lesson for a field-service platform is clear. You do not durably re-rate a business by stapling acquisitions together for arbitrage; you re-rate it by making the combined book higher quality, more recurring, more organic, and higher margin. The multiple follows the quality, and the quality is operational. Financial engineering can capture a re-rating that operations have earned; it rarely manufactures one that they have not.
What this means when you raise or sell
For an owner or a CFO heading into a raise or a sale, the implication is to manage the drivers of the multiple, not just the top line, and to start well before the process opens. Grow and be able to prove the recurring share. Protect and document organic growth as distinct from acquired growth, because a rigorous buyer will separate the two whether or not you do. Show margin gains and tie them to density and productivity, so the improvement reads as durable rather than cyclical. And be ready to show the retention distribution cohort by cohort, because a careful buyer prices the low-retention tail, not the flattering average, and a book that can prove a loyal core is worth more than one that cannot.
This is the discipline Ardenus brings to the operators who run the physical economy. It sits on top of the systems a business already runs and resolves, standardizes, and governs the records underneath, so an operator can measure recurring share, organic versus acquired growth, retention cohort by cohort, and route-level margin as the operational inputs they are. Better measurement improves those inputs, and the inputs are what the public evidence above shows the market prices into a premium multiple. We make no claim that any tool moves a multiple on its own: the link from operational inputs to the multiple is the market’s, documented in the filings and the research cited here, not ours. You can read more of our research on the Ardenus articles hub, or see the platform itself on the technology page.
Sources and methodology
This essay was researched with a multi-agent sweep and then a fact-lock pass that re-verified every figure against its primary source, followed by an adversarial fact-check of every numeric claim. Four limitations are disclosed plainly. First, the live Rollins EV/EBITDA multiple and the resulting premium are aggregator-sourced and stated as of September 2026, because a market multiple cannot appear in a securities filing; they should be re-derived at the moment of use, the peer-cohort multiple carries an earlier (January 2026) as-of date, and that cohort is a broad environmental and waste-services aggregate rather than a curated pest-control comparable set, so the premium is directional rather than an attribution controlled for size, growth, or capital intensity. Second, there is no citable public pest-control or residential-field-service transaction multiple, because the dominant advisor withholds benchmarks, so the essay generalizes from the public-company comparables and Bain’s size-and-return evidence rather than citing an invented sector range. Third, the Bain buy-and-build figures come from a specific 44-deal, 2010 to 2019 sample and the add-on share is North American, by deal count, for 2022; they are cited with those scopes and not over-generalized. No client or first-party operational data is used or disclosed anywhere in this essay, and no result, ratio, or dollar figure is attributed to Ardenus; the input-to-multiple link is the market’s, not a claimed effect of any Ardenus product.
- Rollins, Inc. FY2025 Form 10-K and the Q4 and full-year 2025 earnings release (SEC EDGAR) - the 75% / 10% / 15% recurring mix; 11.0% total growth split 6.9% organic and 4.1% acquisition; 22.7% adjusted EBITDA and 19.3% operating margin.
- Rentokil Initial plc FY2025 Form 20-F (SEC EDGAR) - the roughly 15.5% adjusted operating margin used for the public margin contrast (cited as adjusted, not statutory).
- EV/EBITDA multiples by industry (Environmental & Waste Services) (Aswath Damodaran, NYU Stern, January 2026) - the peer-cohort multiple of about 15.6x for positive-EBITDA firms, the baseline for the premium.
- Rollins (ROL) trailing EV/EBITDA (market data aggregator, as of September 2026) - the live Rollins multiple of about 20x, cited with the as-of and re-derive caveats.
- Global Private Equity Report 2024: Move-In Ready and Building a Stronger Buy-and-Build (Bain & Company) - multiple expansion as the largest return driver (almost 60% of returns), and the 1.4x versus 2.2x MOIC contrast across a 44-deal 2010 to 2019 buy-and-build sample.
- Global Private Equity Report 2023: Anatomy of a Slowdown (Bain & Company) - add-ons at 72% of North American buyouts in 2022, by deal count.
- Valuing Subscription-Based Businesses Using Publicly Disclosed Customer Data (McCarthy, Fader & Hardie, Journal of Marketing, 2017), its non-contractual extension (McCarthy & Fader, Journal of Marketing Research, 2018), and the practitioner treatment How to Value a Company by Analyzing Its Customers (McCarthy & Fader, Harvard Business Review, 2020) - customer-based corporate valuation, value built bottom-up from customer cohorts.