Profit Is Concentrated, Not Averaged
Introduction
Ask a multi-branch operator how profitable its book is and you get one number: an average margin. That number is almost always a fiction, not because the accounting is wrong but because profit is not spread evenly across customers. A handful of accounts earn far more than their share, a large middle roughly washes its face, and a real tail of accounts costs more to serve than it pays and quietly destroys value. Rank the whole book from most to least profitable, add the profit up as you go, and the cumulative line climbs well above the total, peaks, then falls back as the loss-making tail is counted. That shape has a name, and its lesson is that the average margin describes almost no one in the book. The strategic job is not to raise the average; it is to read the shape.
- A few accounts carry the book. When customers are ranked by profit, the most profitable minority generate more than 100 percent of total profit. The average is dragged down from that peak by everyone below them, so it represents neither the winners nor the losers.
- A real tail loses money. Some accounts genuinely cost more to serve than they pay. They are not just low-margin; they subtract from the total, and averaging hides exactly which ones and how much.
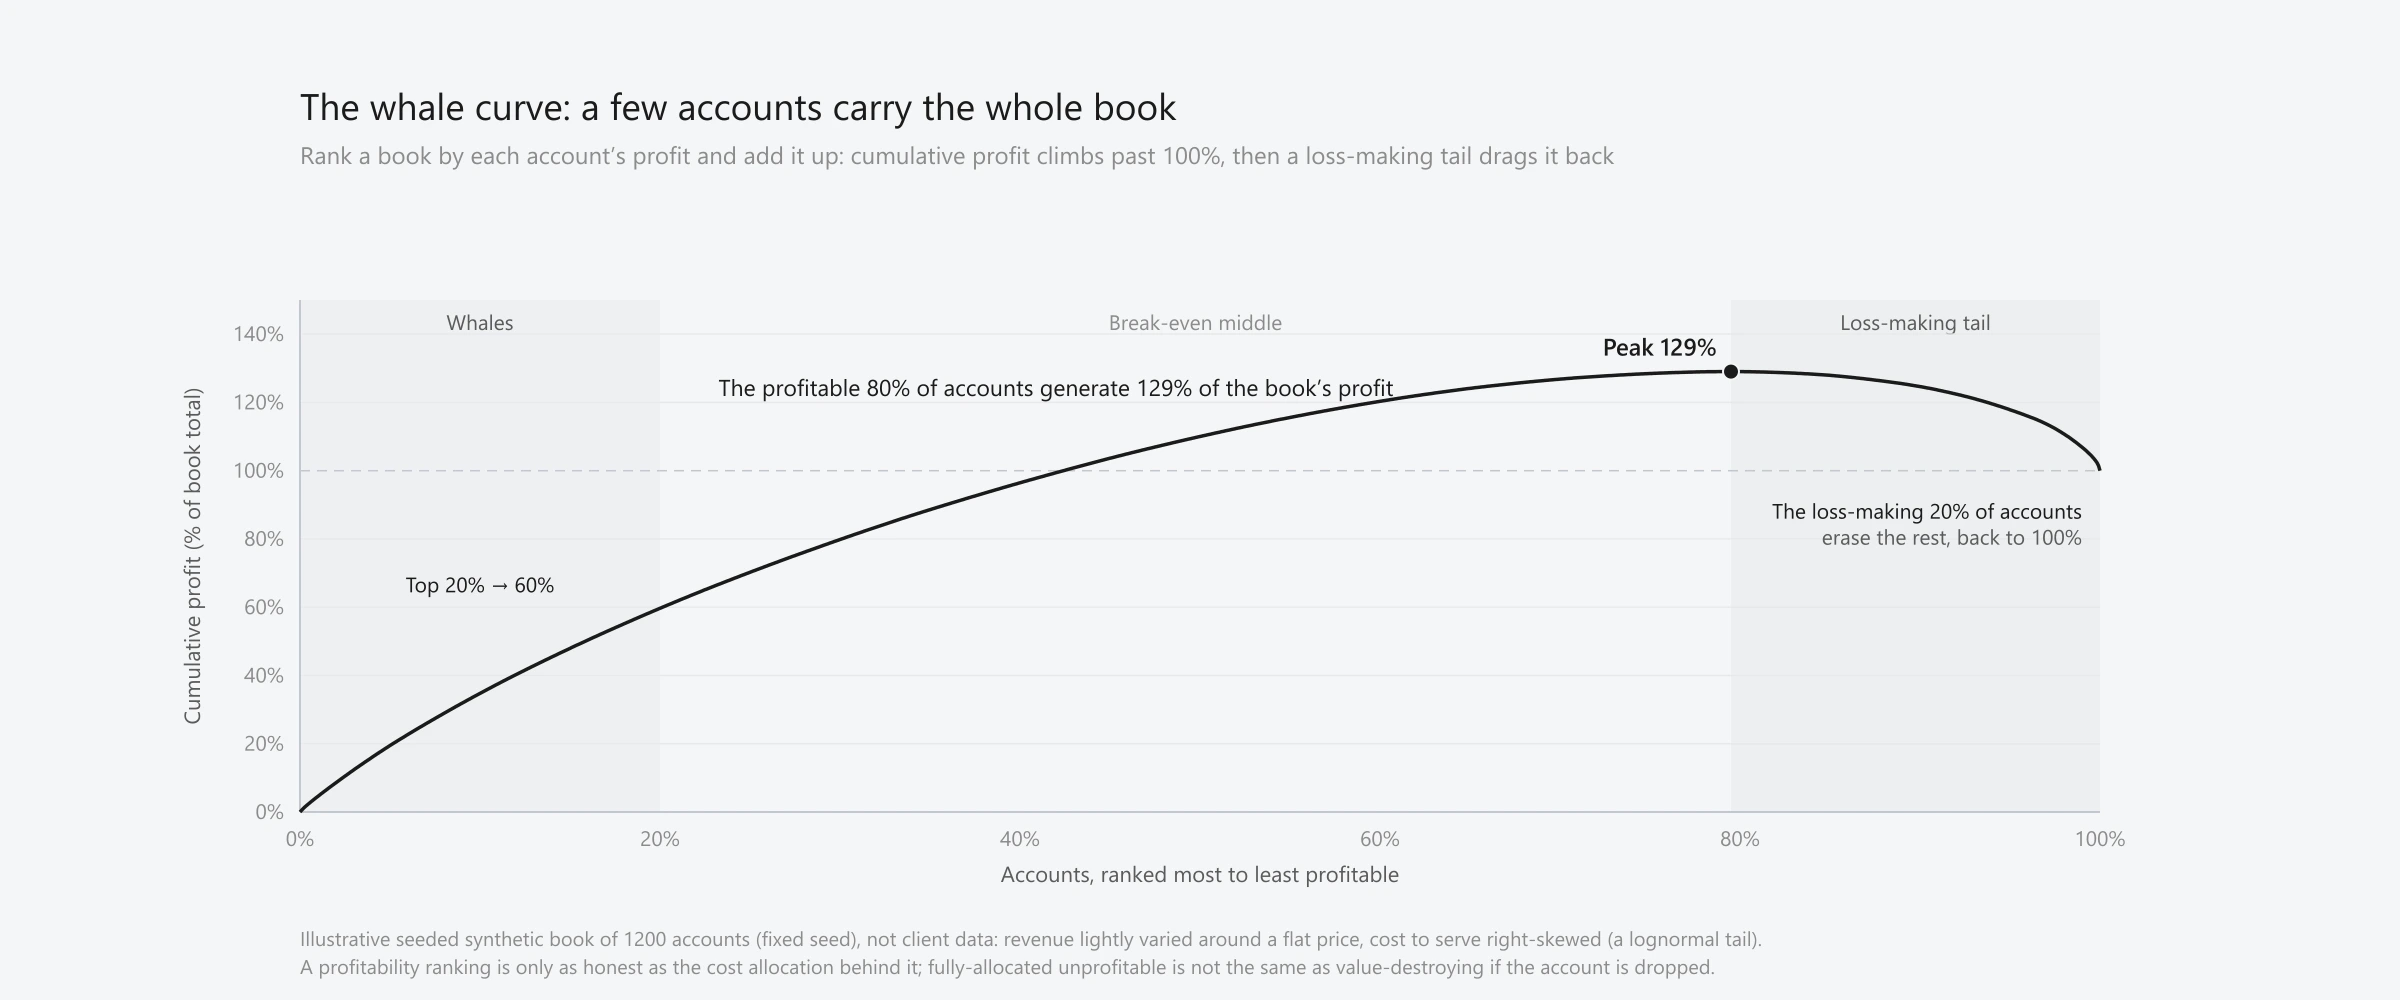
- The shape is computable and reproducible. The whale curve on this page is a seeded, public-parameter simulation with no client data: rank a synthetic book by profit and the cumulative curve peaks near 129 percent before the loss-making tail pulls it back to 100.
- Read three zones, do not average them. Whales get protected and grown, the break-even middle is held, and the value-destroying tail is repriced, re-engineered, or as a last resort let go - but only after separating cost that is truly avoidable from cost that is merely allocated.
What the whale curve is
Start with one number per customer: the profit that account contributes over a year, its revenue minus what it costs to serve. How you compute that single number - the drive time, the on-site minutes, the admin, turned into a cost - is the subject of the companion essay on what it costs to serve a customer, and it is taken as given here. Now rank the whole book from the most profitable account to the least, and walk along that ranking adding each account’s profit to a running total, expressed as a percentage of the book’s total profit. Because the most profitable accounts come first, the cumulative line shoots up past 100 percent; it keeps rising, more slowly, through the accounts that roughly break even; then it turns down as the loss-making accounts are added, until the very last account brings it back to exactly 100 percent, the profit the book actually earned.
That picture has a name. Robin Cooper and Robert Kaplan called it the whale curve in their 1998 book Cost and Effect, for the way the cumulative-profit line breaches 100 percent and then dives like a whale’s back. Its origin is Kaplan’s Kanthal case, where an activity-based look at a manufacturer’s customers first drew the shape; the customer-profitability literature reports its most profitable fifth of customers generating on the order of 225 percent of total profit, with a small loss-making tail erasing the rest. The general pattern was later stated as a range by Kaplan and Narayanan: the most profitable 20 percent of customers generate 150 to 300 percent of a company’s total profit, the middle 70 percent roughly break even, and the least profitable tail destroys the difference. The exact numbers vary by book; the shape does not.
It is not just manufacturing
The Kanthal case is a manufacturer, which invites the objection that this is a factory phenomenon. It is not. The same concentrated shape shows up wherever the cost to serve varies across customers. It has been documented in retail banking, where Storbacka ranked whole bank customer bases and found a small share of customers carrying the profit while a large share destroyed it; in distribution and supply chains, where Niraj, Gupta and Narasimhan measured customer profitability across a real grocery distributor and found it strongly skewed; and in business-to-business industrials, where van Raaij and colleagues built the cumulative curve for a manufacturer and turned it into a management process. The common thread is not the industry; it is that some customers are cheap to serve and some are expensive, and a flat or lightly varied price does not track that spread. A multi-branch pest-control or lawn-care book has exactly that structure - wide variation in drive time, property size, service frequency, and callbacks against a price that barely moves - so the mechanism transfers. What does not transfer are the magnitudes: the 225 percent from a wire manufacturer is not a field-service number, and no figure from those studies should be read as one.
A whale curve you can reproduce
The chart at the top of this page is a whale curve computed from scratch on public, illustrative parameters, with no client data anywhere. It builds a seeded synthetic book of 1,200 accounts: each account is given a revenue drawn from a narrow spread around a flat price, and a cost to serve drawn from a right-skewed distribution - a long tail of expensive accounts, which is what real field-service cost to serve looks like. Profit is revenue minus cost to serve, the book is ranked most to least profitable, and cumulative profit is plotted as a percentage of the total. The curve behaves exactly as the literature describes: it climbs above 100 percent, peaks at about 129 percent once the profitable 80 percent of accounts have been counted, and is then dragged back to 100 percent by the loss-making 20 percent. The most profitable 20 percent of accounts alone generate about 60 percent of the book’s total profit. Every one of these numbers is reproduced and locked by the committed build script from a fixed seed, so the figure and the prose can never drift apart.
It is worth being exact about what this is and is not. It is an illustrative model that shows the mechanism - a spread of cost to serve under a flat price produces a concentrated profit distribution with a loss-making tail - and its specific numbers are properties of the chosen parameters, not a measurement of any operator’s book. It is not client data, aggregated or otherwise, and it does not import the Kanthal or Kaplan-Narayanan percentages as if they were a field-service result. The curve is real arithmetic on a stated model; the point it makes is that a single average margin, laid over a book shaped like this, is a number that describes almost no account in it.
What makes the tail in field service
The loss-making tail is not random; in a route-based service business it has recognizable causes. The largest is drive time to sparse or distant accounts, where the windshield hours between stops swamp the revenue of the visit - the economics of which are the subject of the essay on why route cost follows density, not scale. Close behind are sub-scale accounts, where a full truck-roll and its fixed cost are spent on a tiny ticket; high-touch accounts that generate repeated callbacks, re-treats, and disputes; and frequency mismatches, where an account is visited more often than its property needs. None of these is visible in a blended margin, and each is a cost-to-serve driver rather than a revenue problem, which is why the tail is a costing question before it is a pricing one. Naming the drivers is qualitative here; attaching a defensible cost to each account is the per-unit work described in the cost-to-serve essay, and it is the input this whole distribution is built on.
Fully allocated is not avoidable
Before an account at the bottom of the ranking is called a drain and cut, one caveat has to travel with the whole exercise, because ignoring it turns a useful picture into a costly mistake. A cost to serve computed for the ranking is a fully-loaded allocation: it spreads the fixed cost of trucks, crews, and overhead across the accounts they serve. That allocated cost is not the same as the cost the business would actually avoid if the account left. Drop a single unprofitable customer and the truck, the technician, and the branch overhead do not disappear; the allocated share simply lands on the accounts that remain, which can push the next cohort into the red on paper. An account is genuinely value-destroying only when the revenue it brings is below the cost that would truly go away if it left - its avoidable cost - not its allocated cost. So the tail on the curve identifies candidates for attention, not a list to fire; separating avoidable from allocated cost is the step between reading the shape and acting on it, and every profit figure here is an analytical implication under stated assumptions, not a measured or guaranteed result.
Read the shape: whales, middle, tail
With that caveat in place, the value of the curve is that it sorts the book into three zones that call for different management, none of which is served by the average. The whales - the accounts generating well over their share of profit - are the book’s franchise; the job there is to protect them from being lost to a competitor and to find more accounts like them, and losing one whale can undo the gains from fixing many tail accounts. The break-even middle is held and watched, not churned. The value-destroying tail is the one to act on, and the moves are the ordinary ones: reprice it, re-engineer the cost to serve so the account becomes profitable at its current price, or, as a genuine last resort, let it go. How to reprice a specific account belongs to the companion cost-to-serve essay and is not re-derived here; the whale curve’s distinct contribution is the book-level triage that tells you which accounts get which treatment.
The hard part is rarely the arithmetic; it is acting on it. van Raaij and colleagues found that the obstacle to customer-profitability analysis is organizational, not computational: producing a ranking is easy, but changing prices, service levels, and account ownership on the strength of it runs into the people who own those accounts. Treating profitability analysis as a management instrument rather than a one-off report, and building it into a durable customer-accounting capability, is what separates operators who merely know their whale curve from those who act on it. And doing it across a whole multi-branch book, not a handful of accounts, is a scaling problem in its own right - the reason this is a systems question, not a spreadsheet exercise.
What this means for the operator
For a multi-branch operator, the program is concrete: attach a defensible cost to serve to every account, rank the whole book by profit, look at the shape rather than the average, and manage the three zones differently - protect the whales, hold the middle, and work the tail with the avoidable-versus-allocated test in hand. Doing that turns a single blended margin into a map of where the profit actually lives. It connects directly to the neighboring questions in this research: the per-account costing that feeds the ranking is the subject of what it costs to serve a customer; the drive time that drives the tail is the subject of route cost and density; the reason a loyal account is not automatically a profitable one, and how to think about keeping it, is the subject of why churn is a distribution, not a number; and the reason a cleaner, more profitable book earns a higher price is the argument of why valuation follows revenue quality, not revenue.
The boundary a vendor has to state is plain. Software does not decide which accounts to keep, reprice, or let go; those are the operator’s calls, and a profitability ranking is only as trustworthy as the cost allocation and the avoidable-cost judgment behind it. What a data and intelligence layer can support is the ranking itself: attaching a consistent cost to serve to every account, keeping the whale curve current as the book changes, and surfacing the tail with the avoidable-versus-allocated distinction attached, so the conversation starts from the shape instead of the average. Ardenus is built for that layer and sits on top of the systems an operator already runs, but no result, saving, or forecast is attributed to Ardenus here; the method is the public record of customer-profitability analysis, and no client or first-party data appears anywhere in this essay. You can read more of our research on the Ardenus articles hub, or see the platform itself on the technology page.
Sources and methodology
This essay was researched with a multi-agent sweep across primary sources, followed by an adversarial fact-check of every figure and citation. Its central figure is a self-contained, seeded synthetic computation on public, illustrative parameters, with no client data: it ranks a book of 1,200 accounts (revenue lightly varied around a flat price, cost to serve right-skewed) by profit and plots cumulative profit, and every coordinate - the peak near 129 percent, the profitable 80 percent of accounts, the top 20 percent generating about 60 percent of profit, and the loss-making 20 percent tail returning the total to 100 percent - is reproduced and locked by the committed build script from a fixed seed. The external magnitudes are attributed and presented as a range, never a point estimate: Kaplan and Narayanan put the general whale curve at 150 to 300 percent of total profit from the most profitable 20 percent of customers. The Kanthal case is the origin of the curve; its exact split (roughly 225 percent from the top fifth, with a loss-making tail) is reported in the customer-profitability literature rather than read from the primary case, which is paywalled, so it is presented as literature-reported and not as a precise field-service figure. The per-unit costing method and the per-account pricing moves are the subject of the linked cost-to-serve essay and are not re-derived here; the retention economics of keeping a customer are the subject of the linked churn essay. A fully-allocated cost to serve is treated as an allocation, not an avoidable cost, and the tail is described as candidates for attention, not a list to fire. No client or first-party operational data is used anywhere, and no result, saving, or forecast is attributed to Ardenus.
- Measuring and Managing Customer Profitability (Robert S. Kaplan & V.G. Narayanan, Journal of Cost Management, 2001) - the general whale curve stated as a range: the most profitable 20 percent of customers generate 150 to 300 percent of total profit, the middle roughly breaks even, and the tail destroys the difference.
- Kanthal (A) (Robert S. Kaplan, Harvard Business School case 9-190-002, 1989) - the origin case of the whale curve; its customer-profitability split is cited here as reported in the literature, not read from the paywalled primary.
- Cost and Effect: Using Integrated Cost Systems to Drive Profitability and Performance (Robin Cooper & Robert S. Kaplan, Harvard Business School Press, 1998) - the book that coined the term whale curve for the cumulative-profitability construction.
- Segmentation Based on Customer Profitability: Retrospective Analysis of Retail Bank Customer Bases (Kaj Storbacka, Journal of Marketing Management, 1997) - profit concentration in retail banking customer bases.
- Customer Profitability in a Supply Chain(Rakesh Niraj, Mahendra Gupta & Chakravarthi Narasimhan, Journal of Marketing, 2001) - strongly skewed customer profitability measured across a real grocery distributor.
- The Implementation of Customer Profitability Analysis: A Case Study (Erik M. van Raaij, Maarten J.A. Vernooij & Sander van Triest, Industrial Marketing Management, 2003) - the cumulative-profit (Stobachoff) curve and the finding that acting on it is an organizational problem, not a costing one.
- The Strategic Value of Customer Profitability Analysis (Erik M. van Raaij, Marketing Intelligence & Planning, 2005) - customer profitability analysis as a management instrument for pricing, risk, and positioning decisions.
- An Investigation of Customer Accounting Systems as a Source of Sustainable Competitive Advantage (Morten Holm, V. Kumar & Thomas Plenborg, Advances in Accounting, 2016) - customer-accounting capability as a durable advantage.
- Managing Customers Profitably (Lynette Ryals, Wiley, 2012) - methods for scaling one-customer profitability to a whole-book ranking.